E3 - Venn Diagrams
10 Questions
A group of 40 people were asked if they liked different fruit. A represents the people liked apples and B represents the people liked bananas.
A group of 40 people were asked if they liked different fruit. A represents the people liked apples and B represents the people liked bananas.
A group of 40 people were asked if they liked different fruit. A represents the people liked apples and B represents the people liked bananas.
A group of 40 people were asked if they liked different fruit. A represents the people liked apples and B represents the people liked bananas.
A group of 40 people were asked if they liked different fruit. A represents the people liked apples and B represents the people liked bananas.
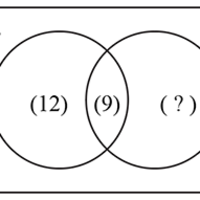
Paul asked 35 people which drinks they liked from tea (T) or coffee (C). He made a Venn diagram to display the data.
Paul asked 35 people which drinks they liked from tea (T) or coffee (C). He made a Venn diagram to display the data.
Paul asked 35 people which drinks they liked from tea (T) or coffee (C). He made a Venn diagram to display the data.
Paul asked 35 people which drinks they liked from tea (T) or coffee (C). He made a Venn diagram to display the data.
Paul asked 35 people which drinks they liked from tea (T) or coffee (C). He made a Venn diagram to display the data.