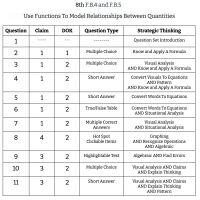
8th Grade Math - F.B.4 and F.B.5 - Use Functions To Model Relationships Between Quantities
11 Questions
Use Functions To Model Relationships Between Quantities Introduction
What is the slope of the line through (5, -1) and (10, 2)?
After a day of raining, a pot left outside had some water in it. After it stopped raining, the water in the pot began to evaporate
This table of values represents a linear function.
Brenda had 120 dollars in her wallet. She spent 5 dollars a day (d) on coffee until her money ran out.
A pop up fly ball is 48 feet in the air when it starts to return to the ground at a rate of 12 feet every 2 seconds.
Shelly was collecting seashells by the seashore. The graph shows the progress of her hunt minute by minute.
A company that rents canoes charges a rental fee plus $8 per hour. The cost for a 6-hour rental is $64.
Erica used the equation 25x + 7y = 131 to model how much money she spent on x tickets and y snacks while at the baseball game.
Georgio was asked if the graph below represented a function. He drew the blue line through the graph to test it.
This table gives a few (x,y) pairs of a line in the coordinate plane.
The question sets found here work best in conjunction with the Strategic Thinking in Math training for grades 1 - 8.
Learn more