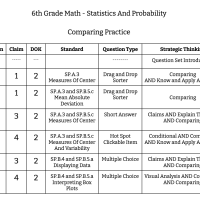
6th Grade Math - Statistics And Probability - Comparing Practice
7 Questions
CCSS.Math.Content.6.SP.A.3
CCSS.Math.Content.6.SP.B.4
CCSS.Math.Content.6.SP.B.5a
CCSS.Math.Content.6.SP.B.5c
1
6th Grade Math - Statistics and Probability - Comparing Introduction
2
Find the median of each data set and then put them in order from least to greatest.
3
Analyze each set of data below.
4
Brandi claims that the mean, median, and mode of the following data set are all less than 8. Do you agree with Brandi? Explain.
5
Click on the data set below that meets the following conditions.
6
Dalton states that that there is no difference between a histogram and a bar graph.
7
Which box plot fits the characteristics listed below?
The question sets found here work best in conjunction with the Strategic Thinking in Math training for grades 1 - 8.
Learn more