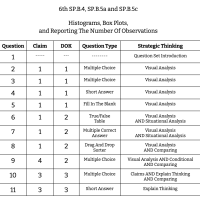
6th Grade Math - SP.B.4, SP.B.5a, and SP.B.5c - Histograms, Box Plots, and Reporting The Number Of Observations
11 Questions
Histograms, Box Plots, and Reporting The Number Of Observations Introduction
Part A: The table below shows the number of books read over the holiday break by Mr. Argula's class. Which histogram correctly represents the data?
Part B: How many students are in Mr. Argula's class?
Part A: Look at the box plot. What do the numbers 3 and 13 represent in this box plot?
Part B: Look at the box plot. What percent of the values are between 0 and 13?
Sandi threw some darts at a dart board and recorded her scores.
Which TWO of the following sets of data could have produced the box plot below?
Look at the four visual representations of data below. Each one is labeled with a letter.
Which box plot fits the characteristics listed below?
Dalton states that it is easier to determine the number of observations in a data set using a histogram than a box plot.
What can you conclude from a box plot that contains long boxes and short whiskers?
The question sets found here work best in conjunction with the Strategic Thinking in Math training for grades 1 - 8.
Learn more