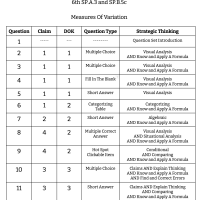
6th Grade Math - SP.A.3 and SP.B.5C - Measures Of Variation
11 Questions
Measures Of Variation Introduction
Part A: The Addison High School softball team is looking at their statistics for the first half of the season.
Part B: The Addison High School softball team is looking at their statistics for the first half of the season. Find the interquartile range for the data set below.
Part C: The Addison High School softball team is looking at their statistics for the first half of the season. Find the range for the data set below.
Thomas just opened up a new bakery. The data below represents how many customers he had on his first seven days of business.
Analyze the data set below. Determine the median, the first and third quartiles, the interquartile range, and the range.
Look at the data set below. It is missing two numbers.
Erica is conducting a survey about people's favorite rainbow colors. She creates a dot plot to show the data. Which statements are true about the dot plot below?
Click on the data set below that meets the following conditions.
Liam just finished his first semester of high school. He is analyzing his biology test scores to see how he could improve next semester.
Brandi claims that the interquartile range will always be less than the range in any given data set. Do you agree with Brandi? Explain by using an example.
The question sets found here work best in conjunction with the Strategic Thinking in Math training for grades 1 - 8.
Learn more