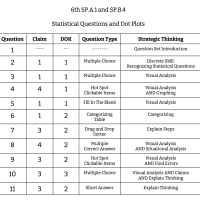
6th Grade Math - SP.A.1 and SP.B.4 - Statistical Questions and Dot Plots
11 Questions
Statistical Questions and Dot Plots Introduction
Determine which of the following choices is a statistical question.
Match the table to its correct dot plot.
Part A: Several students missed Mr. Svensen's last math quiz. Those scores are listed in the table below.
Part B: According to the data how many students received a score of 6 or better on the quiz?
Determine whether each question is a statistical question or not.
When gathering data for a statistical question, what are the logical steps a researcher should take? Put the steps in the correct order.
Which of the following questions could have produced the dot plot below? Select ALL that apply.
Yolanda was transferring her data from the table to the dot plot. She made two errors. Click on the areas where she made her errors.
Willie wants to know the average amount of video games that teenagers own. He surveys thirty teenagers. He graphs the results below.
Is the question below a statistical one? Explain.
The question sets found here work best in conjunction with the Strategic Thinking in Math training for grades 1 - 8.
Learn more