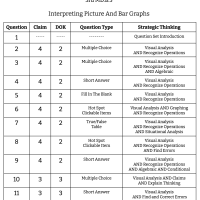
3rd Grade Math - MD.B.3 - Interpreting Picture And Bar Graphs
11 Questions
Interpreting Picture And Bar Graphs Introduction
The graph below shows the average high temperatures from January to June in the city where Katya lives.
Many parents brought cookies for the school bake sale. Analyze the chart and picture graph below.
Zoey made quesadillas for her four children; Jen, Jim, John, and Joan.
The students in Ms. Quiroz's class voted on their favorite sport. The graph below shows how many students voted for each sport.
The table below shows the amount of pages read by Mrs. Hansen's class over the weekend.
Mr. Graybill's class voted on their favorite ice cream toppings. The graph below shows how many kids voted for each topping.
Rico was asked to convert the table into a picture graph. He made a mistake. Click on the part of the picture graph where he made his mistake.
Dequan made a picture graph in which each heart represents some number of students. He forgot to complete the key.
Oakdale High School girl's basketball team had a game yesterday. The graph below shows how many points each player scored.
Ms. Stevenson's assistant, Aleksander, was asked to make a bar graph of the latest math quiz scores. The quiz was worth 20 points. His graph is shown below.
The question sets found here work best in conjunction with the Strategic Thinking in Math training for grades 1 - 8.
Learn more