A - Categorical Data
20 Questions
Which one is an example of categorical data?
Which one is not an example of categorical data?
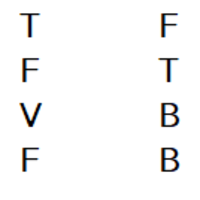
25 students were asked their favorite sports. There results are shown below, F=Football, B=Basketball, V=Volleyball, T=Tennis.
25 students were asked their favorite sports. There results are shown below, F=Football, B=Basketball, V=Volleyball, T=Tennis.
25 students were asked their favorite sports. There results are shown below, F=Football, B=Basketball, V=Volleyball, T=Tennis.
A farmer counted the number of animals on his farm. He displayed the numbers in the graph below.
A farmer counted the number of animals on his farm. He displayed the numbers in the graph below.
A farmer counted the number of animals on his farm. He displayed the numbers in the graph below.
A farmer counted the number of animals on his farm. He displayed the numbers in the graph below.
Max is collecting data about people's favorite movie genres. After conducting a survey, he has gathered the following information:
Max is collecting data about people's favorite movie genres. After conducting a survey, he has gathered the following information:
Max is collecting data about people's favorite movie genres. After conducting a survey, he has gathered the following information:
Max is collecting data about people's favorite movie genres. After conducting a survey, he has gathered the following information:
The chart below shows the way students get to school.
The chart below shows the way students get to school.
The chart below shows the way students get to school.
The chart below shows the way students get to school.
The summary of Mike's monthly expenses in a chart is below. The pie chart displays the data in the chart.
The summary of Mike's monthly expenses in a chart is below. The pie chart displays the data in the chart.
The summary of Mike's monthly expenses in a chart is below. The pie chart displays the data in the chart.