C - Graphs of Categorical Data
20 Questions
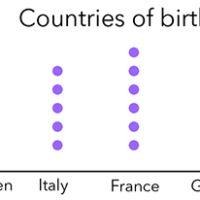
Some students in an international school were asked their countries of birth. The dot plot of the data is shown below.
Some students in an international school were asked their countries of birth. The dot plot of the data is shown below.
Some students in an international school were asked their countries of birth. The dot plot of the data is shown below.
Some students in an international school were asked their countries of birth. The dot plot of the data is shown below.
A music store recorded the types of sold CDs in the last week. A dot plot of the data is shown below:
A music store recorded the types of sold CDs in the last week. A dot plot of the data is shown below:
A music store recorded the types of sold CDs in the last week. A dot plot of the data is shown below:
A music store recorded the types of sold CDs in the last week. A dot plot of the data is shown below:
Mimi wanted to know the class's favorite travel destination city. She conducted a survey and displayed the data using a column graph below.
Mimi wanted to know the class's favorite travel destination city. She conducted a survey and displayed the data using a column graph below.
Mimi wanted to know the class's favorite travel destination city. She conducted a survey and displayed the data using a column graph below.
Mimi wanted to know the class's favorite travel destination city. She conducted a survey and displayed the data using a column graph below.
The graph below shows the employees' coffee preferences in a company.
The graph below shows the employees' coffee preferences in a company.
The graph below shows the employees' coffee preferences in a company.
The graph below shows the employees' coffee preferences in a company.
The graph below shows the percentages of hair colors in a primary school where 200 students attend.
The graph below shows the percentages of hair colors in a primary school where 200 students attend.
The graph below shows the percentages of hair colors in a primary school where 200 students attend.
The graph below shows the percentages of hair colors in a primary school where 200 students attend.