6-8th Grade Science - MS-PS3-1 - Kinetic Energy, Mass, and Speed
6 Questions
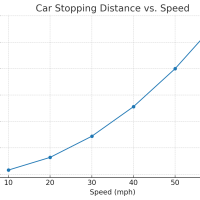
Use the graph Car Stopping Distance vs. Speed to answer the question.
Which statement best explains the pattern shown in the graph?
A small car (1,000 kg) and a large SUV (2,000 kg) both drive at 20 m/s (72 km/h). Complete the sentences using the drop-down menus.
Part A: Based on the graph of Kinetic Energy vs the Square of the Speed for the skateboarder, select two statements that are supported.
Part B: Based on the graph of Kinetic Energy vs. the Square of the Speed for the skateboarder, decide whether each statement is True or False.
Use the graph Kinetic Energy vs Speed for Two Riders on a Skateboard to show how mass and speed affect kinetic energy.
We help forward-thinking Californian districts achieve significant CAASPP score improvements in Science, Language Arts, and Math. Our NGSS-aligned questions ask students to analyze, model, and reason through real-world science challenges.
Learn more