3rd Grade Science - 3-ESS2-1 - Typical Weather Conditions
6 Questions
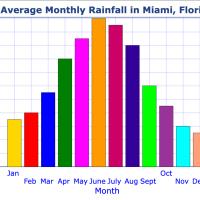
The bar graph below shows the average monthly rainfall in Miami, Florida. The rainfall is measured in millimeters (mm).
PART A: The table below shows the average high temperatures (in Fahrenheit) for four U.S. cities during different months of the year.
PART B: The table below shows the average high temperatures (in Fahrenheit) for four U.S. cities during different months of the year.
Two third-grade classes tracked the weather in their hometowns during the month of January.
Letty made the line graph below to show the average monthly temperature in her town of Columbus, Ohio.
Boone recorded the weather conditions in a small town over the course of one year. The results are shown in the pie graph below.
We help forward-thinking Californian districts achieve significant CAASPP score improvements in Science, Language Arts, and Math. Our NGSS-aligned questions ask students to analyze, model, and reason through real-world science challenges.
Learn more