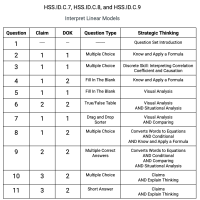
S.ID.C.7, S.ID.C.8, and S.ID.C.9 - Interpret Linear Models
11 Questions
S.ID.C.7, S.ID.C.8, and S.ID.C.9 - Interpret Linear Models
A tech department models a laptop’s battery life L (in hours) after C charge cycles with the linear model
A study aggregates data from 40 high schools on average weekly screen time (hours) and average nightly sleep (hours) for 11th graders.
A linear model fitted to shuttle data is
Three scatterplots (A, B, C) show different linear relationships; each includes a line of best fit.
Researchers collected school-level data relating class size (students) and average test score. Their results are shown in the scatterplot below.
Each plot (1–4) shows a different linear relationship with a line of best fit.
Scientists recorded air temperature T (°C) and cricket chirps per minute C across evenings. The association was described as a weak negative linear association.
Scientists are designing a study to measure the effect of a new medication. Let x be dose (mg) and y be an improvement score (points).
A linear regression on the data gives
Allie claims: “If there is a strong correlation between two variables, then one caused the other.”
We help districts in California boost CAASPP Math Scores by Δ +20% by helping teachers determine if students are struggling with the content, the technology involved with the type of question, or the type of strategic thinking required. Based on the 8 Standards for Mathematical Practice, our platform and professional development empowers teachers to recognize all 16 types of strategic thinking across any math question, curriculum, or assessment.
Learn more