CR 7 - A.REI.D.11 - Target E
1 Question
CCSS.Math.Content.HSA.REI.D.10
CCSS.Math.Content.HSA.REI.D.11
CCSS.Math.Content.HSF.IF.C.9
STIM.B.Visual Analysis
STIM.D.Claims
STIM.E.Explain Steps/Thinking
STIM.I.Comparing
STIM.P.Pattern
1
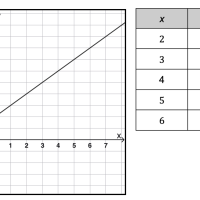
The graph and the table shown below represent two different linear functions that form a system.
We help districts in California boost CAASPP Math Scores by Δ +20% by helping teachers determine if students are struggling with the content, the technology involved with the type of question, or the type of strategic thinking required. Based on the 8 Standards for Mathematical Practice, our platform and professional development empowers teachers to recognize all 16 types of strategic thinking across any math question, curriculum, or assessment.
Learn more