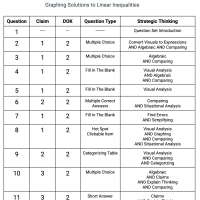
A.REI.D.12a - Graphing Solutions to Linear Inequalities
11 Questions
A.REI.D.12a - Graphing Solutions to Linear Inequalities
Which inequality represents the graphed solution set?
Which statement best describes the solution set of the inequality shown below?
A graph has a dashed boundary line
Sarah makes friendship bracelets. The graph below represents the number of bracelets sold (x) and her revenue (y, in dollars).
You want the shaded region of y < –x + 2 to no longer include the origin (0, 0).
A student is graphing the linear inequality shown below.
The graph shows the boundary line of a linear inequality. The solution region is not shaded.
For each inequality, select the category that best describes how its graphed solution set compares to the graphed inequality.
Ava makes the following claim:
Leo makes the claim that if two inequalities share the same boundary line on a graph, the shaded regions will always overlap.
We help districts in California boost CAASPP Math Scores by Δ +20% by helping teachers determine if students are struggling with the content, the technology involved with the type of question, or the type of strategic thinking required. Based on the 8 Standards for Mathematical Practice, our platform and professional development empowers teachers to recognize all 16 types of strategic thinking across any math question, curriculum, or assessment.
Learn more