A.REI.D.10 and A.REI.D.11 - Represent and Solve Equations Graphically (Linear, Rational, Radical)
11 Questions
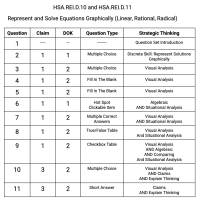
A.REI.D.10 and A.REI.D.11 - Represent and Solve Equations Graphically (Linear, Rational, Radical)
The solutions to the system involving f(x) and g(x) are:
The graph represents the equation:
The functions f(x) and g(x) are shown on the graph below.
Between which two consecutive integer values of x does the solution to the equation f(x)=g(x) occur?
Some values of h(x) and m(x) are shown in the table below.
The graphs of y=f(x) and y=g(x) are shown.
Identify which pair of functions below satisfies all three criteria.
Compare the two functions shown below.
Sammie graphed two functions, g(x) and f(x), on a graphing calculator.
Sarvin makes the following claim:
We help districts in California boost CAASPP Math Scores by Δ +20% by helping teachers determine if students are struggling with the content, the technology involved with the type of question, or the type of strategic thinking required. Based on the 8 Standards for Mathematical Practice, our platform and professional development empowers teachers to recognize all 16 types of strategic thinking across any math question, curriculum, or assessment.
Learn more