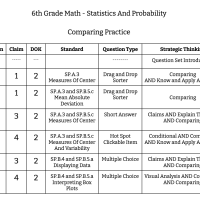
6th Grade Math - Statistics And Probability - Comparing Practice
7 Questions
6th Grade Math - Statistics and Probability - Comparing Introduction
Find the median of each data set and then put them in order from least to greatest.
Analyze each set of data below.
Brandi claims that the mean, median, and mode of the following data set are all less than 8. Do you agree with Brandi? Explain.
Click on the data set below that meets the following conditions.
Dalton states that that there is no difference between a histogram and a bar graph.
Which box plot fits the characteristics listed below?
We help districts in California boost CAASPP Math Scores by Δ +20% by helping teachers determine if students are struggling with the content, the technology involved with the type of question, or the type of strategic thinking required. Based on the 8 Standards for Mathematical Practice, our platform and professional development empowers teachers to recognize all 16 types of strategic thinking across any math question, curriculum, or assessment.
Learn more